

SCOFrance
9Descriptive vegetation classes
Useful linkProject page
PartnersCerema Est and Occitanie, Métropole du Grand Nancy, Laboratoire LIVE-A2S de l’Université de Strasbourg, TerraNIS, CNES
Key wordsUrban vegetation, ecosystem services, nature-based solutions
GUS, an observatory for urban vegetation
Held in hybrid format on 24 April 2024 at Cerema Occitanie in Toulouse (France), the GUS feedback meeting was a great success with all participants. And with good reason: while the methodology may seem technically complex to the uninitiated, the display of results in the Landia interface (ex Green City) is perfectly clear and tailored to the needs of urban space managers.
GUS lays the foundations for fine mapping of vegetation
GUS is the spatial component of the wider Des hommes et des arbres (Men and trees) project, which is designed to assess the ecosystem services provided by vegetation in towns and cities. It has tackled the essential requirement for such an assessment: to know and describe vegetation in detail using the most automated method possible, based on satellite data. With this in mind, Cerema has thought through and designed its spatial data processing method with the absolute aim of offering all territories a common reference system for using vegetation data.
Without going into the details of the methodology used (which are explained on the project page), the following points should be highlighted:
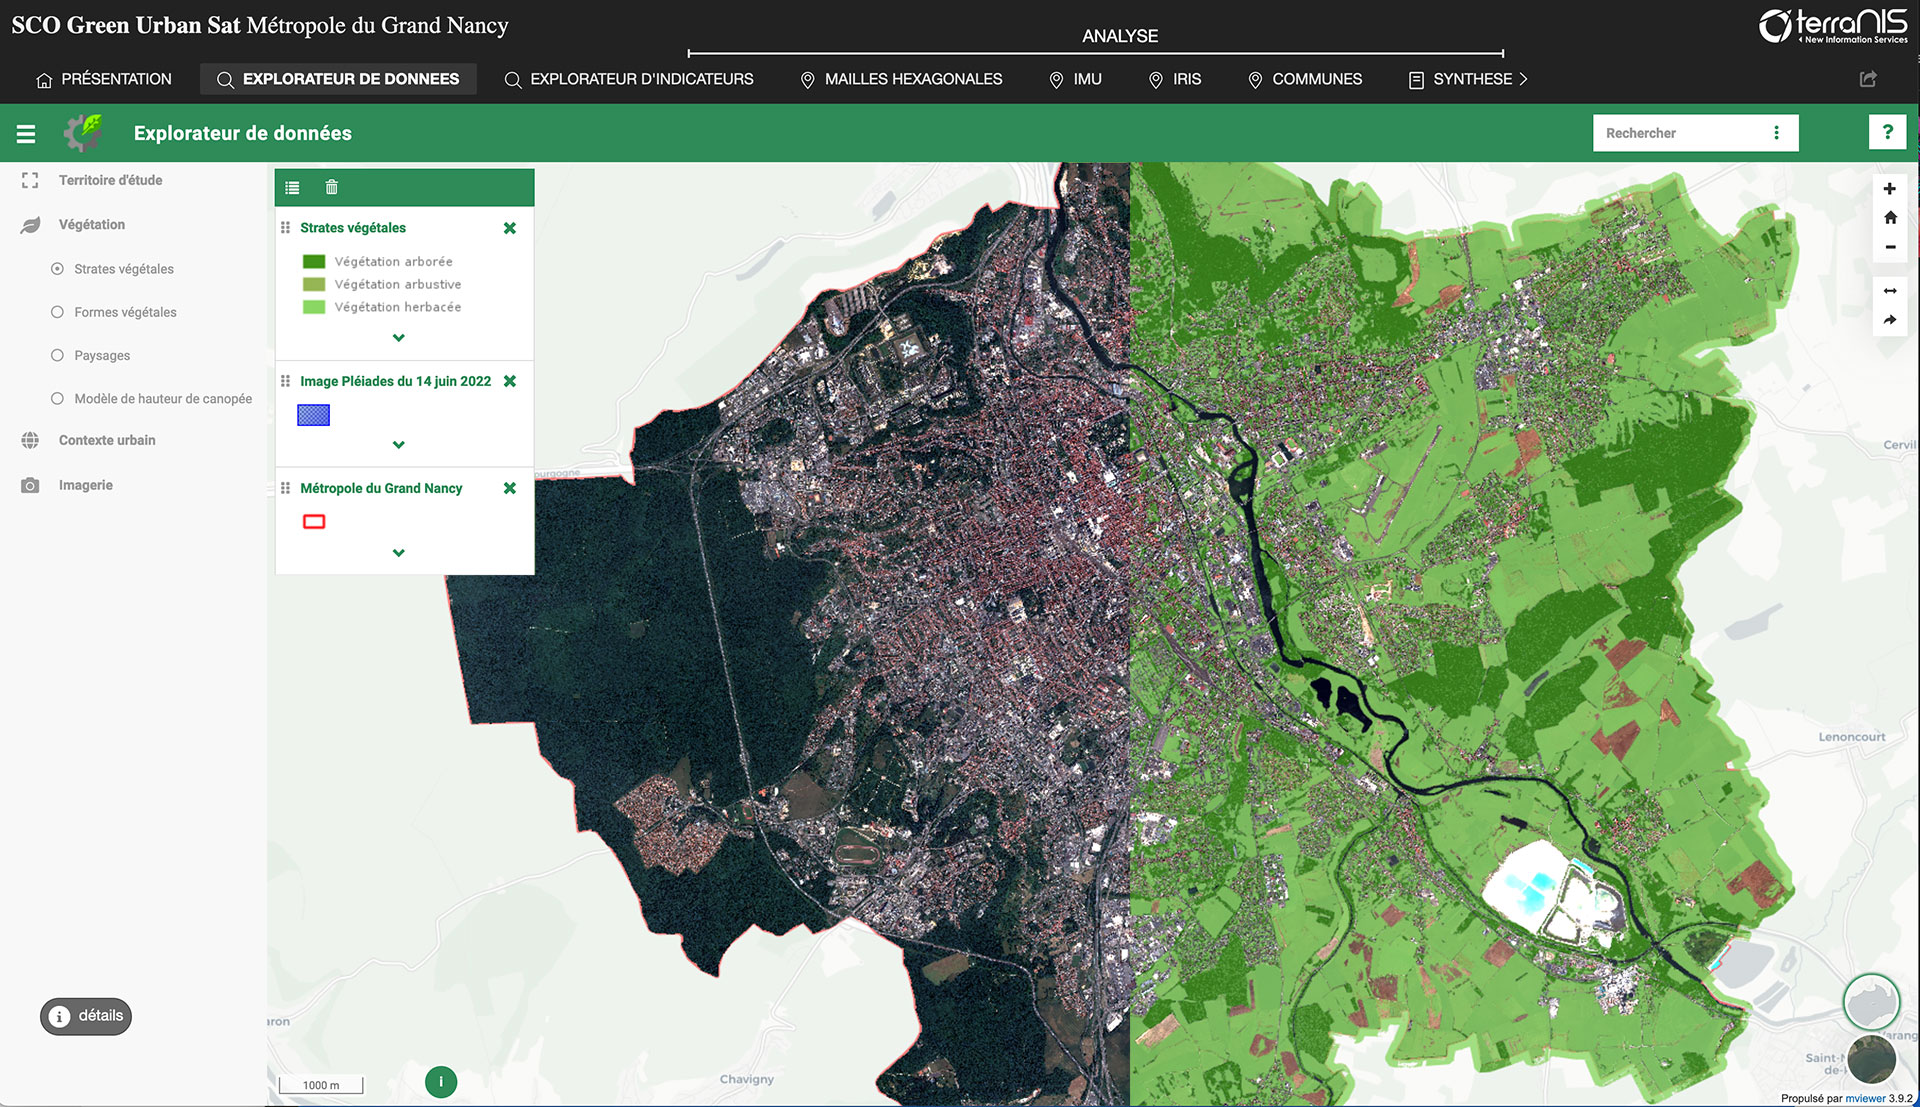
- The starting point is a very high-resolution Pleiades image.
- 2 levels of vegetation description are extracted from this image:
- the morphology of the vegetated structures (herbaceous, shrubby, arborous, which are then refined according to their forms, such as isolated trees, lines of trees, etc.)
☞ 9 vegetation classes identified - the landscape (urban, semi-urban, agricultural, forestry), according to the Local Climate Zone (LCZ) classification
☞ GUS used the mapping developed by the SCO SatLCZ project in Nancy, based on the same Pleiades input image.
- the morphology of the vegetated structures (herbaceous, shrubby, arborous, which are then refined according to their forms, such as isolated trees, lines of trees, etc.)
- The GIS layer, the production code for which is available on Cerema's github, can be viewed and used on the Green City portal and soon on the Des Hommes et des Arbres geoplatform (without the attributes in the latter case).
Landia, demonstrating the use of data
Developed by TerraNIS, the Landia platform (ex Green City) displays all the raw data generated by Cerema from satellite images, calculates indicators and generates summaries. The interface is divided into two main sections:
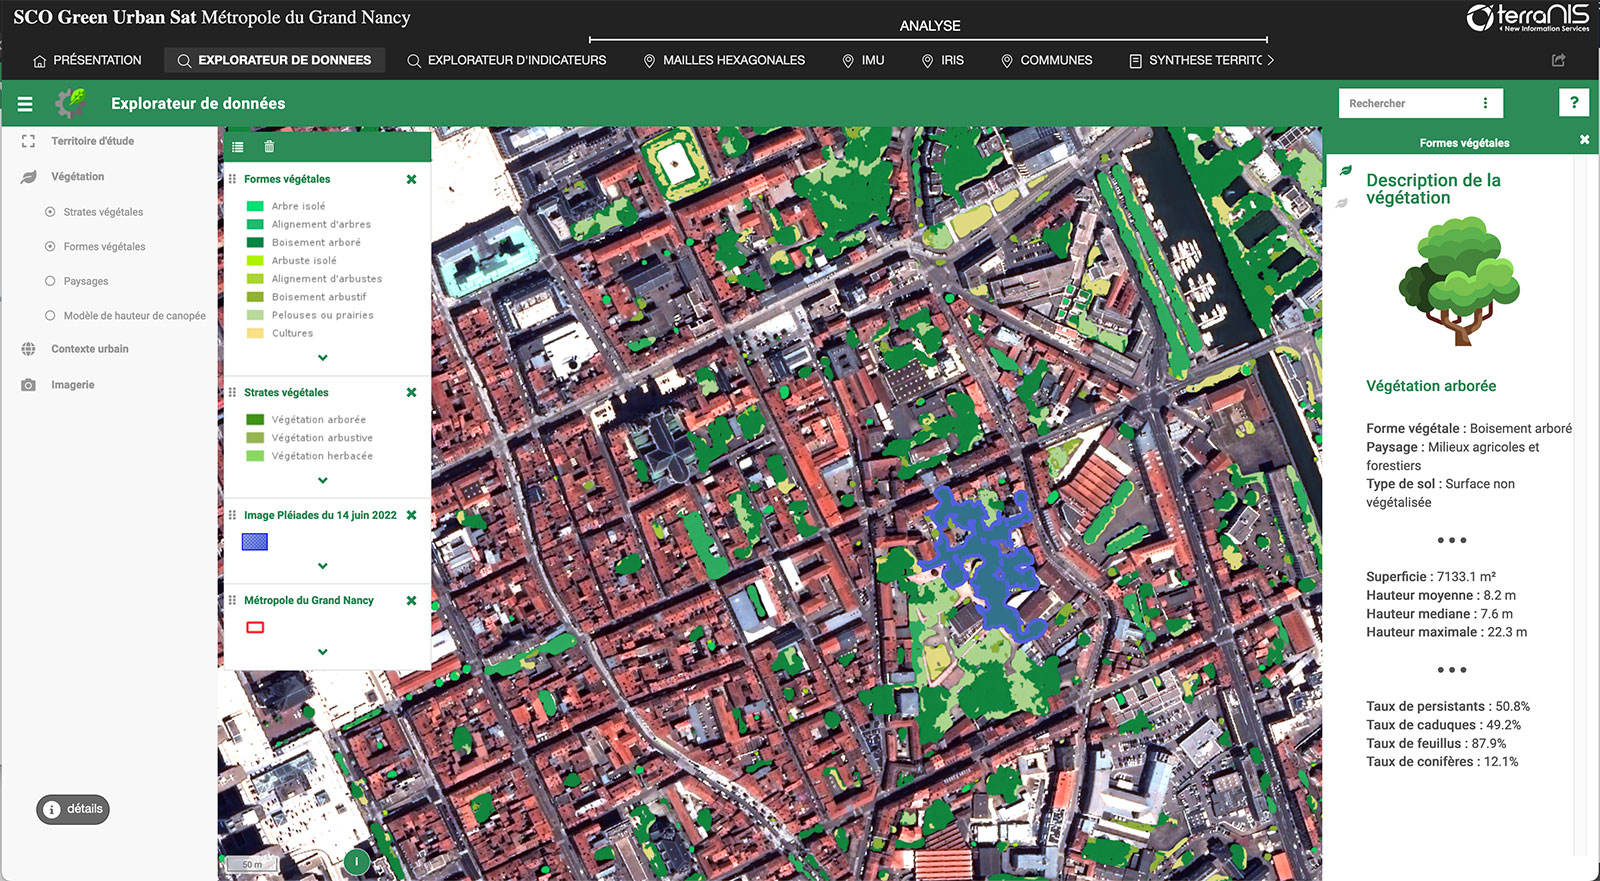
- Data and indicator explorer
|
► The user can display different masks (vegetation strata (this view), shapes, landscape and land cover, canopy height, LCZ). It is possible to select a hexagon (purple area in the centre of this image) or group of hexagons, for which the statistical indices are displayed on the right of the screen. © Terranis |
 |
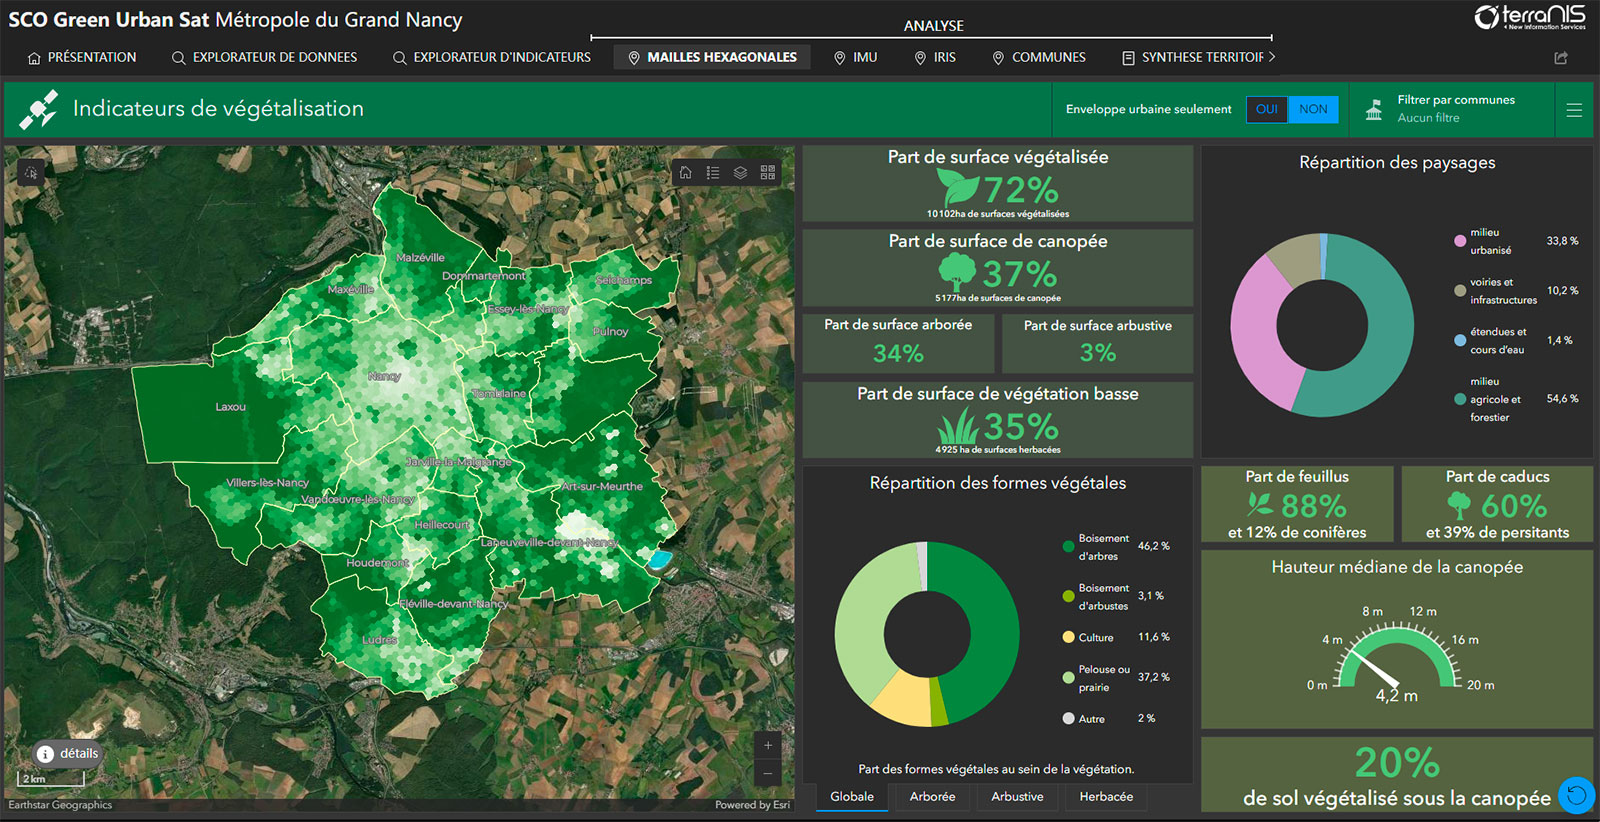
- A dashboard that summarizes information at different scales to make it easier to understand, analyze and, ultimately, decide on future developments.
|
► Offering a synthetic view of the area at several scales, the dashboard is organized into a map accompanied by 4 blocks of information: vegetation indices, distribution of plant forms, distribution of landscapes and plant characteristics. © Terranis |
 |
Use and prospects
The current demonstrator is already being used by the Greater Nancy Metropolitan Area, which wants to continue using it to help it carry out a multi-scale diagnosis of its plant heritage and respond to a number of specific issues. These include the need to encourage the infiltration of rainwater and to renew tree species that are dying out and no longer adapted to climate change.
Work will also continue on the Des Hommes et des Arbres project, with a view to studying the ecosystem services provided by vegetation in terms of microclimate regulation, hydrological regulation, maintenance of ecological continuity, and socio-cultural and landscape services. This will make it possible to move from an observatory of vegetation to an observatory of the ecosystem services of vegetation, which would then be a fully-fledged decision-making tool.
Motivated by these results and the prospects for their application, the GUS team would like to develop an optimized V2, which will be easier to replicate in other areas, and will provide more detailed information on the shapes and landscapes observed.