EO4InterTopo automates intertidal topographic mapping
Intertidal zones play a crucial role as a natural barrier to protect the coast from the effects of climate change, such as the increased frequency and intensity of extreme events. Regular monitoring of their evolution is necessary to improve their management.
Launched in January 2024, the EO4InterTopo project aims to provide annual mapping of these areas using both optical and radar satellite data. The main objective is to build digital terrain models (DTMs) for the topography of the Normandy coastline between the Bay of Mont-Saint-Michel and the Bay of the Somme (France), covering the period 2016-2025.
Towards full automation of intertidal DTMs
In the first few months, the work focused on evaluating the methods used to construct DTMs.
Waterline method
The waterline method, often considered the most effective for studying intertidal topography, was applied to the Baie des Veys, the Utah beach and the Seine estuary. These three sites present a variety of environments, enabling a robust evaluation of the method's performance.
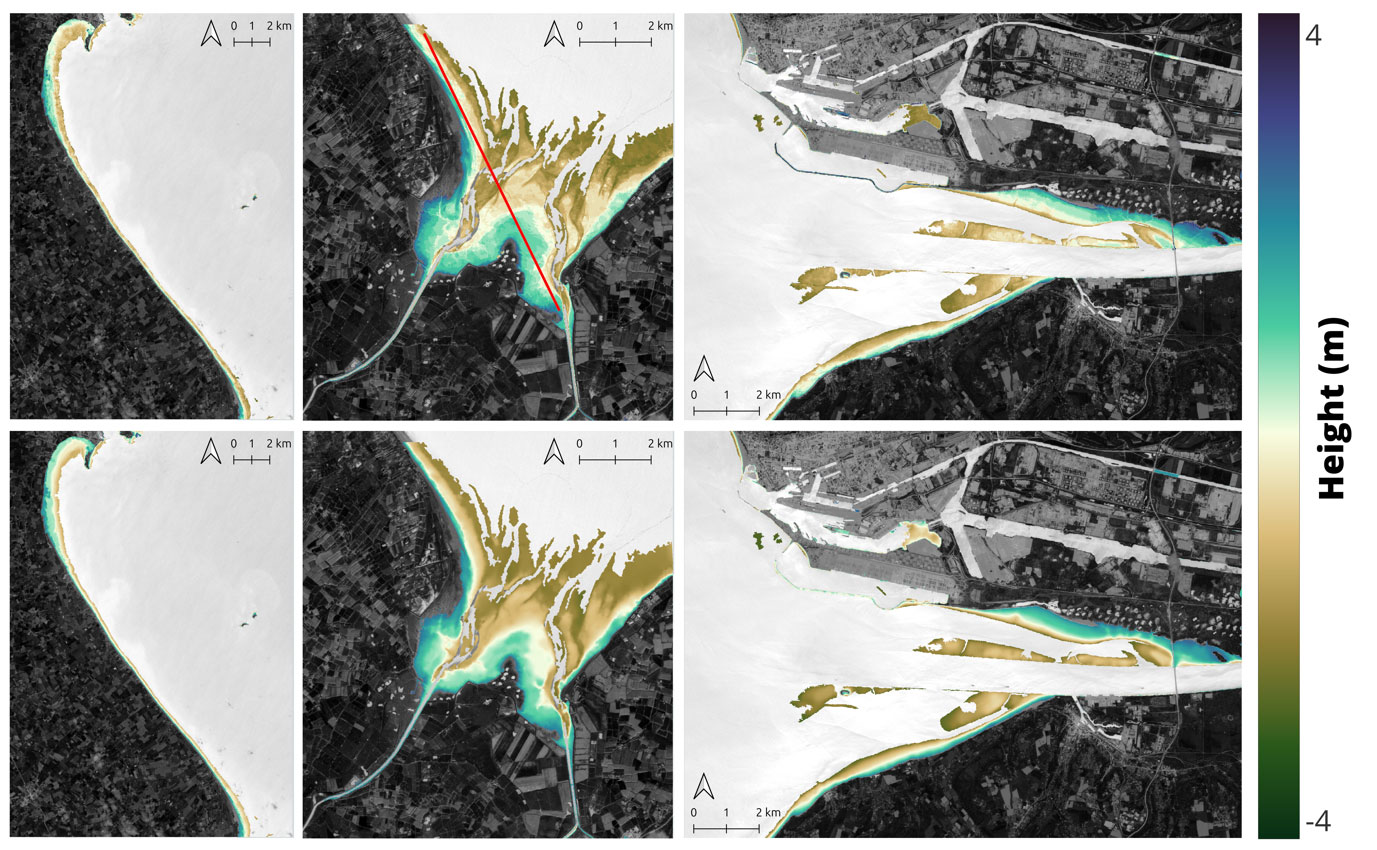
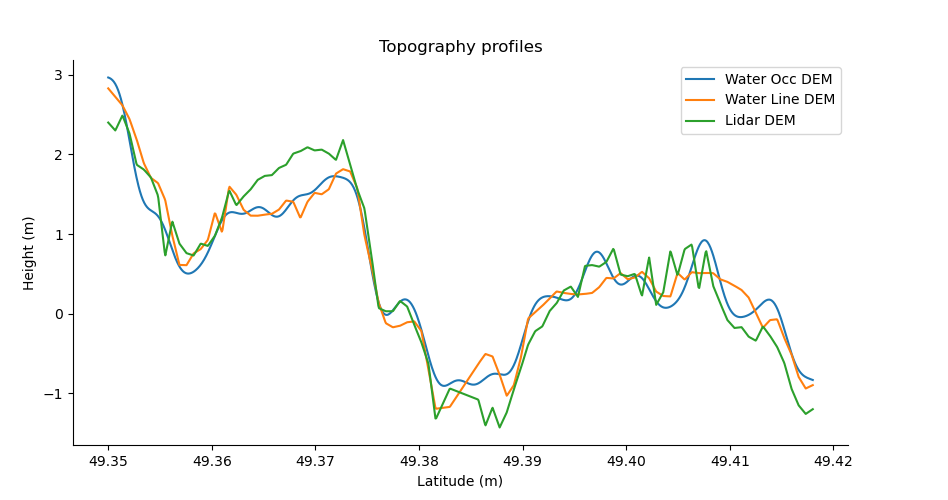
👉The results obtained with the waterline method are in agreement with the lidar data from the Coastal Observation Network ROL (Réseau d'Observation du Littoral) (Figures 1 and 2). However, as this method relies on image segmentation between water and land areas to extract the contours of the land/sea interface, it requires manual adjustments that complicate its large-scale application, particularly on the Normandy coastline, which prompted the project to explore other methods.
Water occurrence method
"We have primarily tested pixel-based approaches, such as those of Chen et al (2023) with "Tide2Topo" and Yang et al (2022) with "Coastxray". These methods produce water occurrence maps from land/sea segmentations on a series of images. The percentage of water occurrence for each pixel is linked to the topography, with low-lying areas having a higher occurrence and vice versa. Then, based on the work of Fassoni-Andrade et al (2020), the occurrence of water is linked to a probability of submersion, making it possible to find the depth based on water level forecasts from the HYCOM model," explains Edward Salameh, an expert in coastal morphodynamics at the CNRS and the project leader.
👉This method is easier to apply over large areas as it is based solely on water occurrence maps without requiring the manual corrections required by the waterline method.
|
▶︎ Figure 1: 2020 DTM of the three study sites using the water occurrence method (top) and the waterline method (bottom). The red line represents the cross-section illustrated in Figure 2. © UMR6143 M2C-CNRS |
|
|
▶︎ Figure 2: Topographic profiles of DTMs for the Baie des Veys for the year 2020 produced using the water occurrence method (blue), the waterline method (orange) and Lidar data (green). © UMR6143 M2C-CNRS |
|
👉 "Preliminary comparisons between these two methods on our three study sites show equivalent performance, but with the second method being easier to use, enabling it to be applied more quickly on the scale of the Normandy coastline. This is why a combination of these two methods seems to be appropriate to meet the objectives of the project", explains Simon Dechamps, research engineer at the CNRS. A publication is currently being drafted to present the comparison of the two methods and suggest areas for improvement.
SWOT: A key mission for intertidal zones
The EO4InterTopo project also relies on the new SWOT wide-swath altimetry mission which, thanks to its KaRIn interferometric radar, measures water levels in the oceans and terrestrial surface reservoirs with unprecedented accuracy. Initially designed for water, SWOT has proved to be an effective tool for measuring the topography of intertidal zones (Salameh et al., 2024).
👉Unlike approaches based on optical or SAR (radar) images, SWOT enables topographic reconstruction that is completely independent of in-situ data and hydrodynamic models, making it easier to automate processing and scale up.
👉Intertidal DTMs were generated from SWOT data acquired at low tide and validated using Lidar measurements taken by drone, showing high reliability (Figure 3). These results confirm the potential of SWOT for monitoring intertidal zones, offering an essential source of data for tracking the evolution of these dynamic environments that are sensitive to the impacts of climate change.
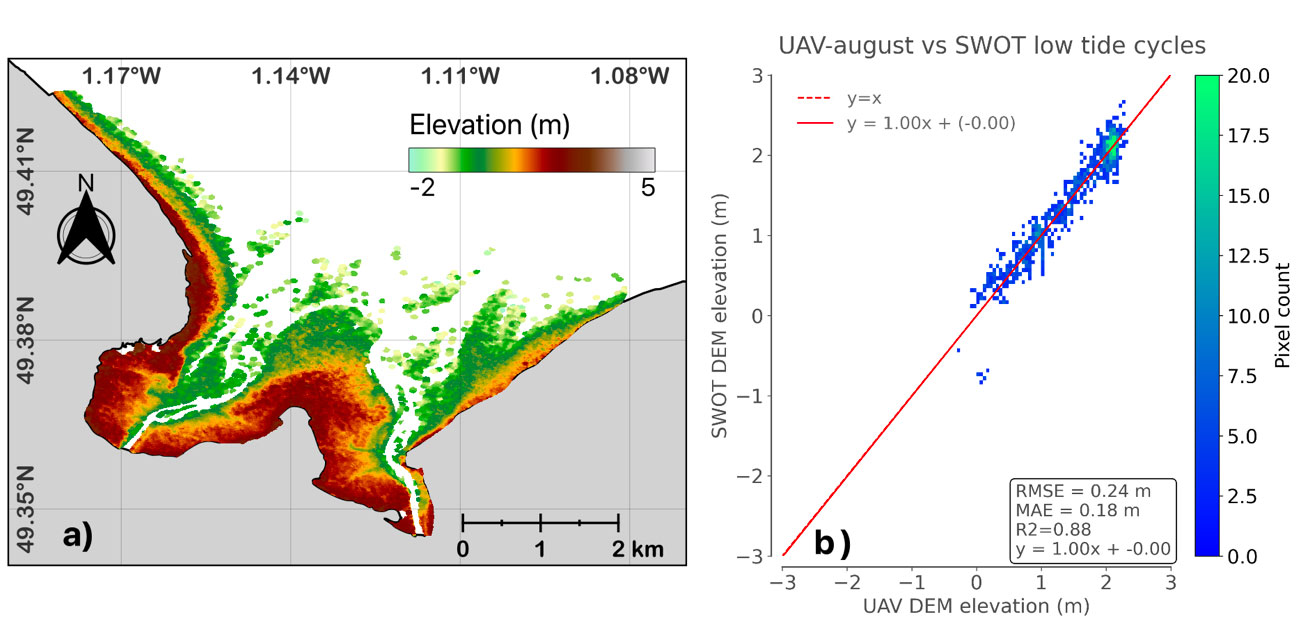
Figure 3: (a) SWOT-derived intertidal DTM from cycles acquired at low tide and (b) comparison with a DTM generated from drone Lidar measurements. © Salameh et al. (2024)
Next step: mapping the type of substrate
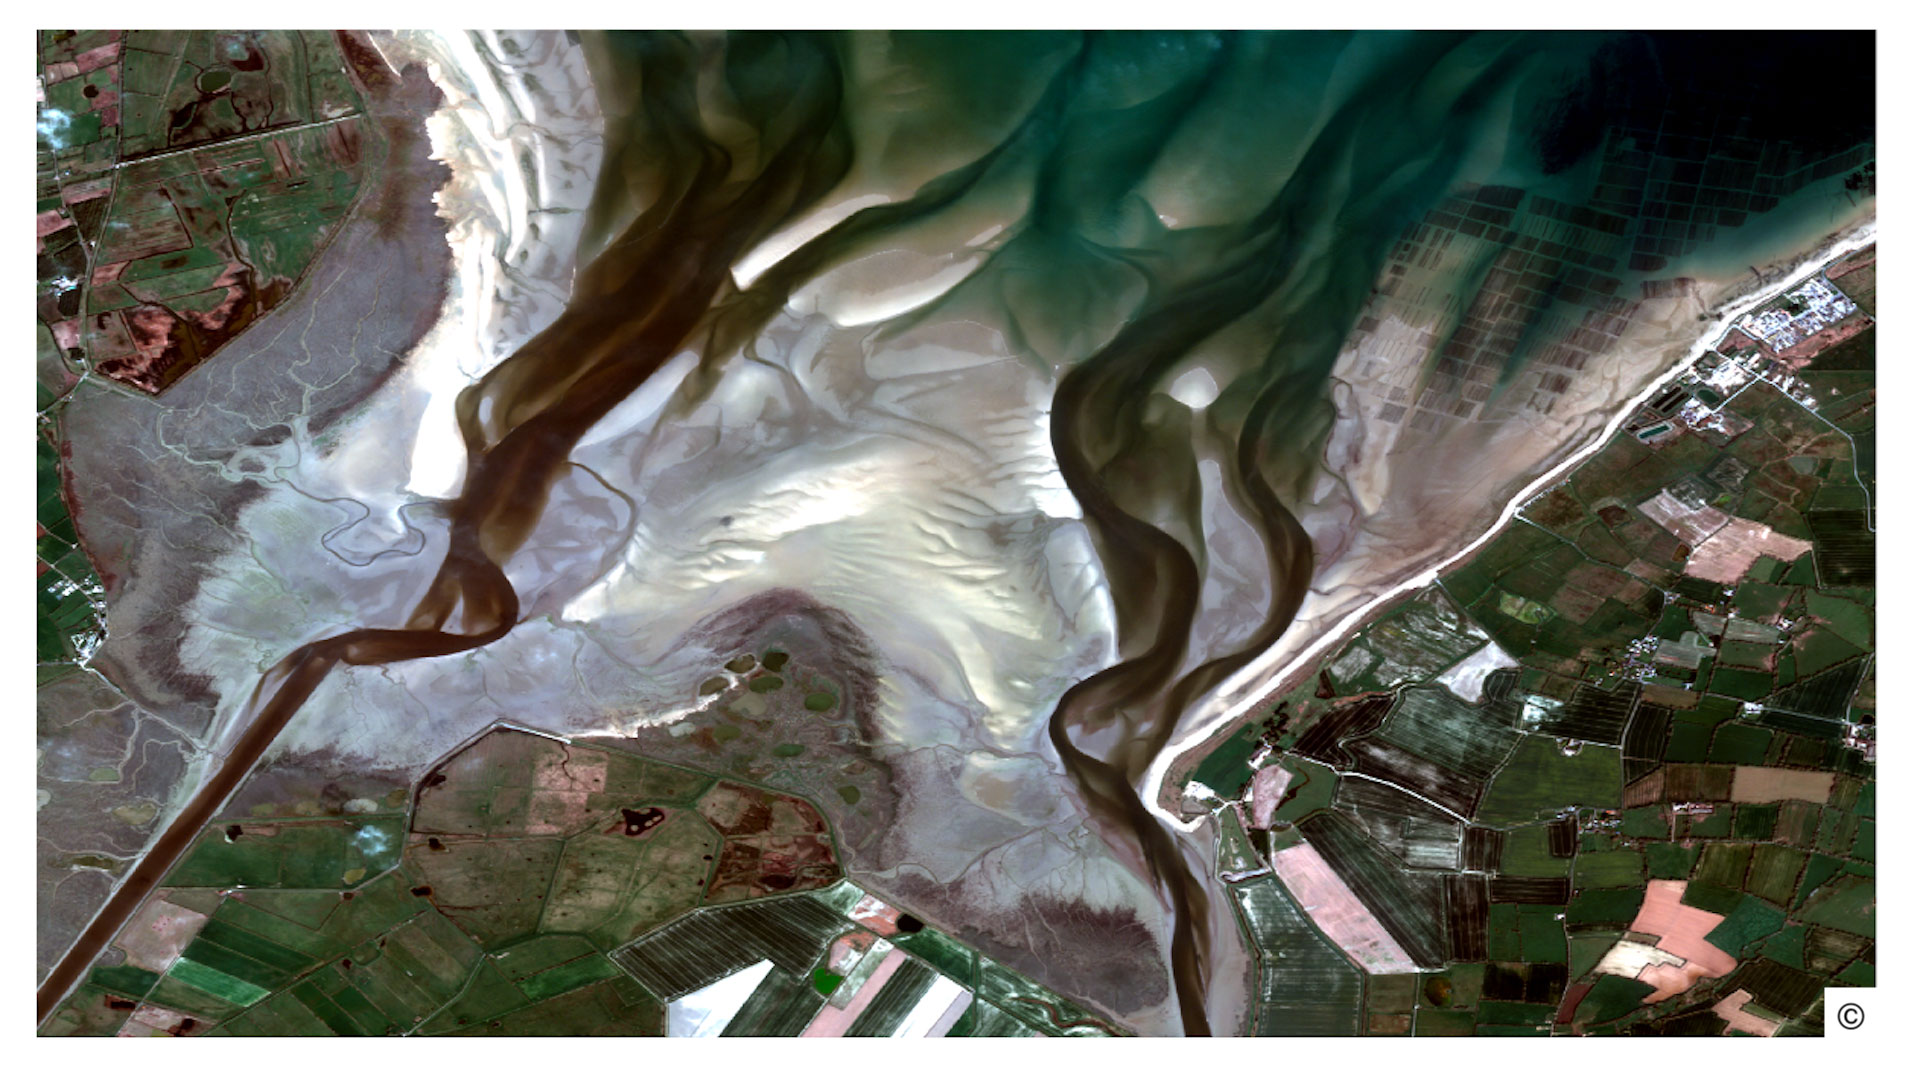
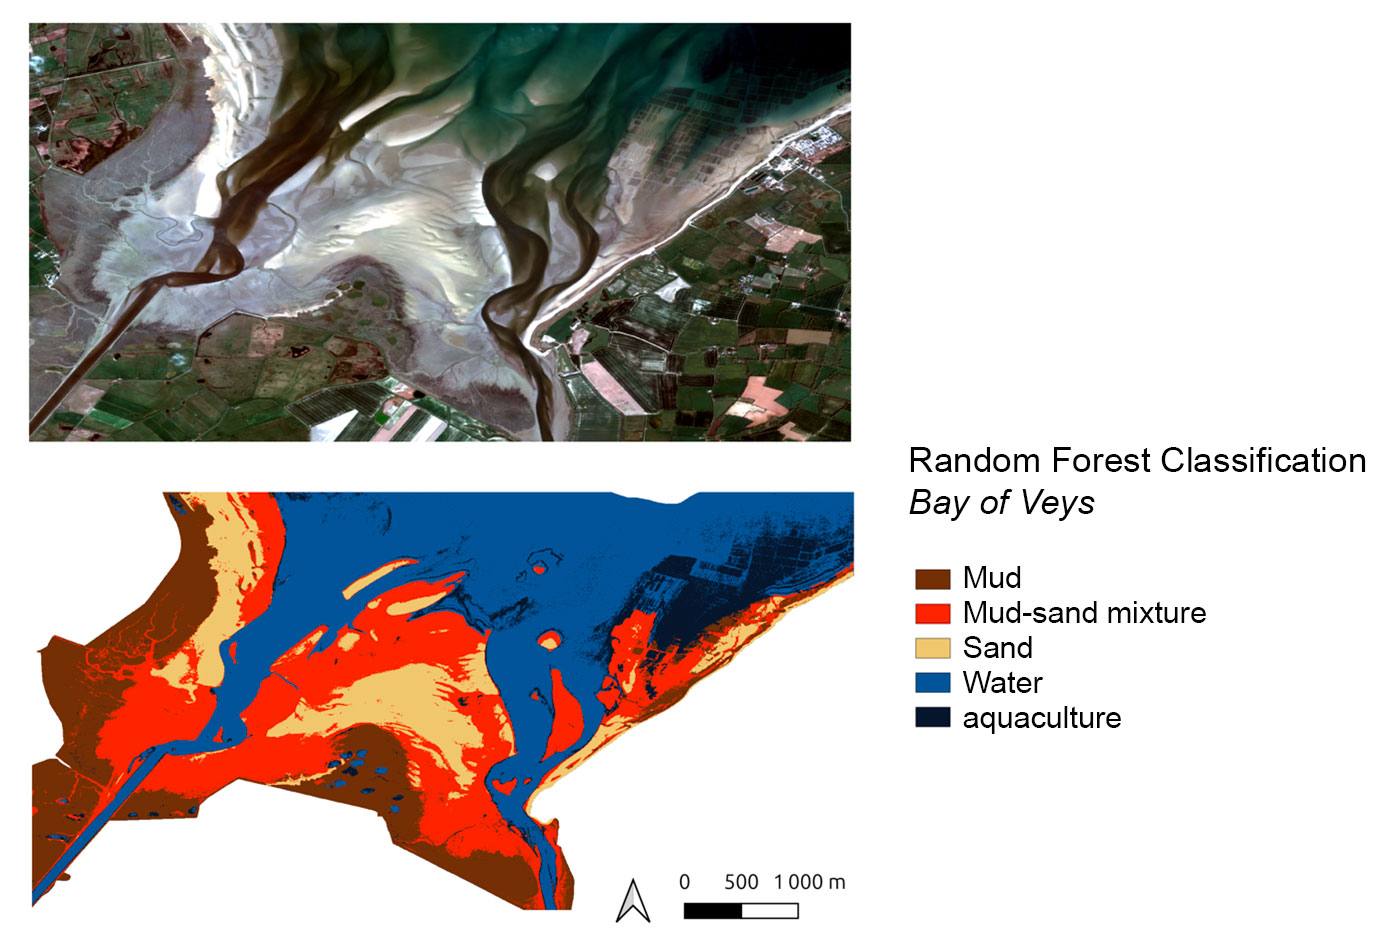
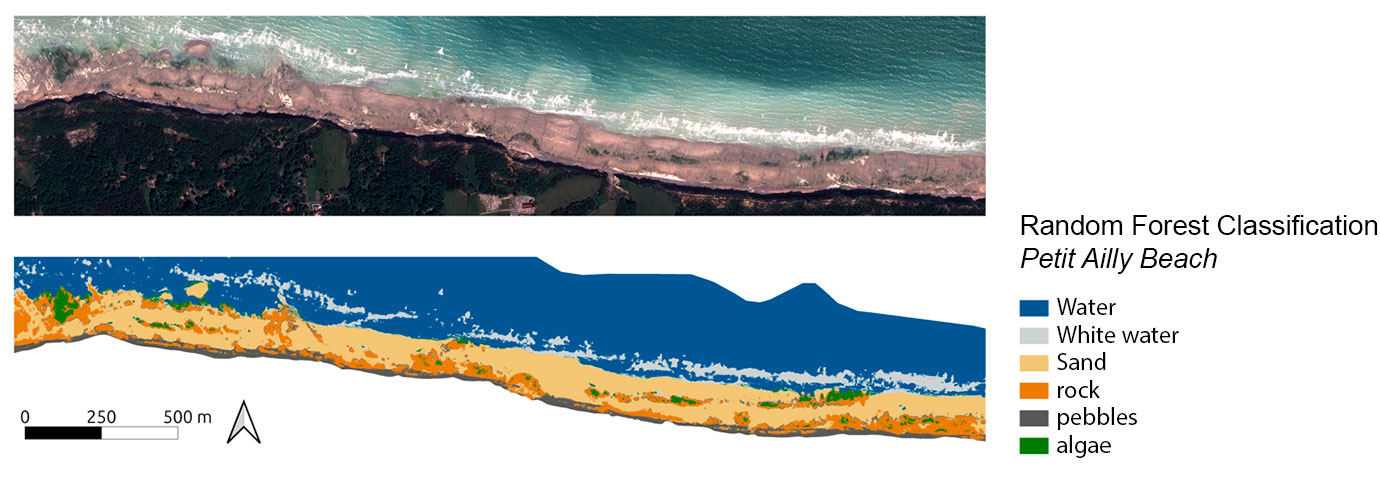
The study of the evolution of the topography of the coastline is accompanied by a classification of the type of substrate that makes up the intertidal zone. To do this, Pleiades data acquired at low tide will be classified over the entire coastline using a supervised classification model capable of distinguishing between the water, sand, mud, aquaculture sites, pebbles and rock that make up the substrate.
👉 According to Edward Salameh, "this mapping will make it possible to complete the interpretations of the evolution of the topography in the intertidal zone. Although two sites have been studied for this classification (see Figures 4 and 5), the diversity of sediments present on the coast means that the model needs to be trained on a larger number of sites before we can offer consistent results on a large scale".
|
▶︎ Figure 4: Result of the classification of the Baie des Veys substrate using Pleiades data. Supervised classification using the "random forest" model. © UMR6143 M2C-CNRS |
|
|
▶︎ Figure 5: Result of the classification of the substrate of the Petit Ailly beach to the west of Dieppe using Pleiades data. Supervised classification using the "random forest" model. © UMR6143 M2C-CNRS |
|


