

SCOFrance
PartnersWaltR, AtmoSud, CNES
Useful linkPresentation of the project
Key wordsAir quality, greenhouse gases, air pollutants, anthropogenic emissions, emissions inventory
EDISON: air quality is a question of scale
|
SCO accredited in March 2023, the EDISON project is presenting its initial work on the very source of changes in air quality and climate change: man-made emissions. The aim is to develop an online platform capable of helping public policymakers to manage air quality by cross-referencing emissions measurements with data on a given area, its activity, population, industry, etc. The idea is to provide a systemic vision of a given area to guide public action in the face of complex, interwoven issues. |
Let's be clear! |
As Marion Moreira, WaltR's project manager, points out, "resources of this kind are becoming necessary, and ADEME (French Environment and Energy Management Agency) is already providing the initial steering tools to support local authorities. Rather than redeveloping yet another platform where others already exist, our added value with EDISON is to provide better quality data, as well as data that does not currently exist, which can then be integrated into existing platforms. The portal developed for EDISON will serve as a showcase for this premium data”.
EDISON's first progress report provides a very interesting description of the French context and the constraints faced by local authorities.
Preamble: a question of scale
Understanding emissions from human activities and developing actions to reduce them must take into account several dimensions of scale:
- Administrative levels: a local authority can only act on issues that fall within the remit of its administrative level, and on sources that are physically located within its territory. However, a local emission may extend beyond its source, and, in fact, an area may be affected by pollution from a source outside its borders.
- Territorial scales: France has a wide variety of territories with very different realities depending on their typology (rural commune, large metropolis, etc.) and geographical location (algae pollution in the West Indies and Brittany, wood heating in the Auvergne-Rhône-Alpes region, ports in the PACA region, etc.).
- Physical scales: not only are air pollutants and greenhouse gases highly variable in terms of their lifespan, but a number of natural factors such as topography and weather (temperature and wind) have an impact on the transport of these compounds and the possible chemical interactions between them.
Stage 1: discussions with the regions
Already a partner of the Nice Côte d'Azur metropolis, the team is keen to co-build the tool with as wide a range of local authorities as possible. Of the 40 interview requests received, 12 were accepted: ADEME (national level), 3 DREAL (regional level), 6 local authorities (municipal level) and 2 ASSQA (approved air quality monitoring associations). 7 of them wish to continue discussions with the project.
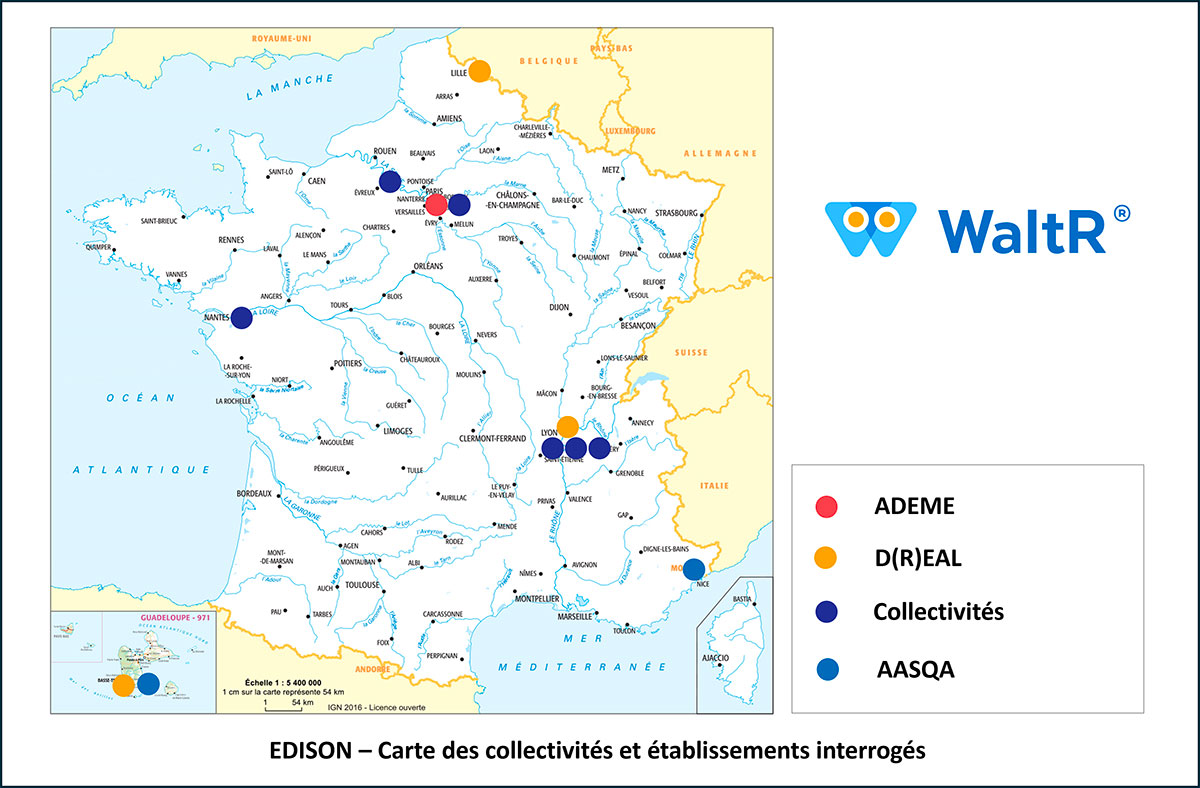 |
◀︎ Map of local authorities and institutions surveyed. Representing every scale of the country, from rural to urban areas, including overseas departments and territories, the diversity of the panel will enable the project team to work on a system that can be replicated in other places and at different scales. © WaltR |
These discussions enabled the EDISON team to gain initial feedback on the main concerns and needs of these players, and it was noted that there was a lack of data to monitor actions and of tools to manage them. In a complex French regulatory framework, the relevance of focusing development at the intermediary level of inter-municipality emerged.
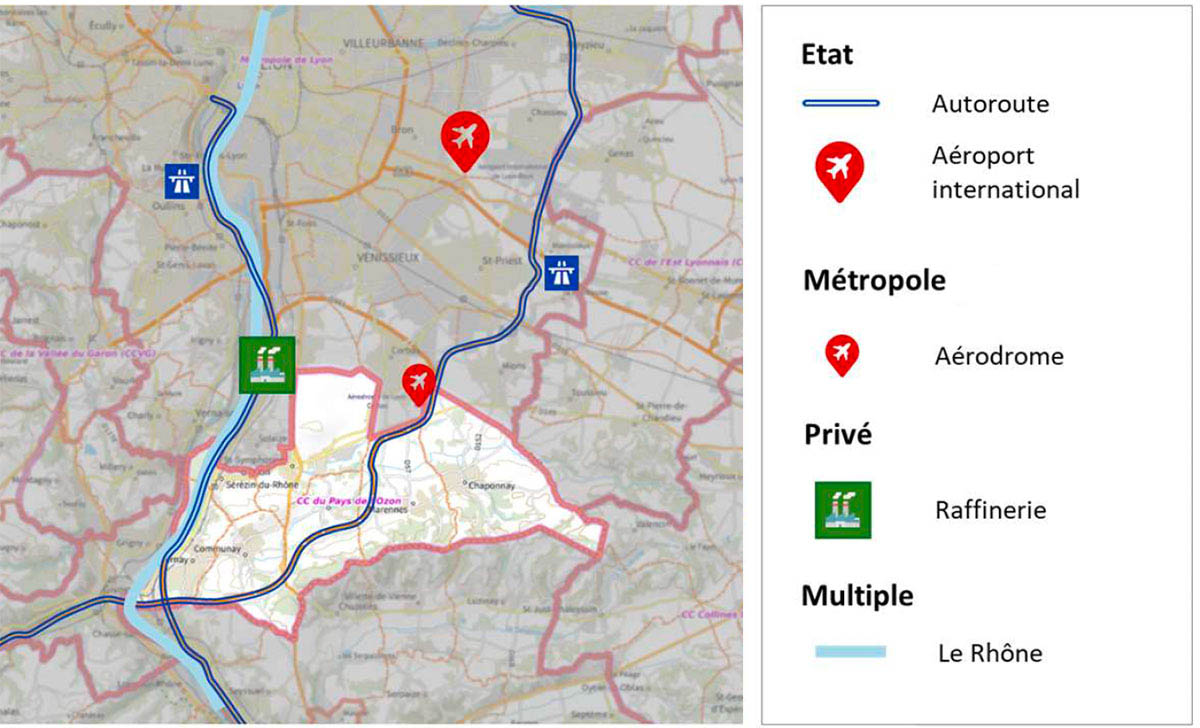
As mentioned in the previous paragraph, a single municipality emits and suffers from pollution, but it does not have control over most of the emitting sectors (see example below). If, on the other hand, the scale is too large (national or regional scale, for example), the specific characteristics of each area can no longer be taken into account and the measures taken, because they are too general, risk losing their effectiveness
|
► An example of a municipality crossed by two motorways and which has an airport, which is the responsibility of the State, an airfield, which is the responsibility of the neighboring metropolis, a refinery, which is private industrial property, and a river, which is the responsibility of several parties. © WaltR
|
|
Stage 2: Emissions monitoring mapping
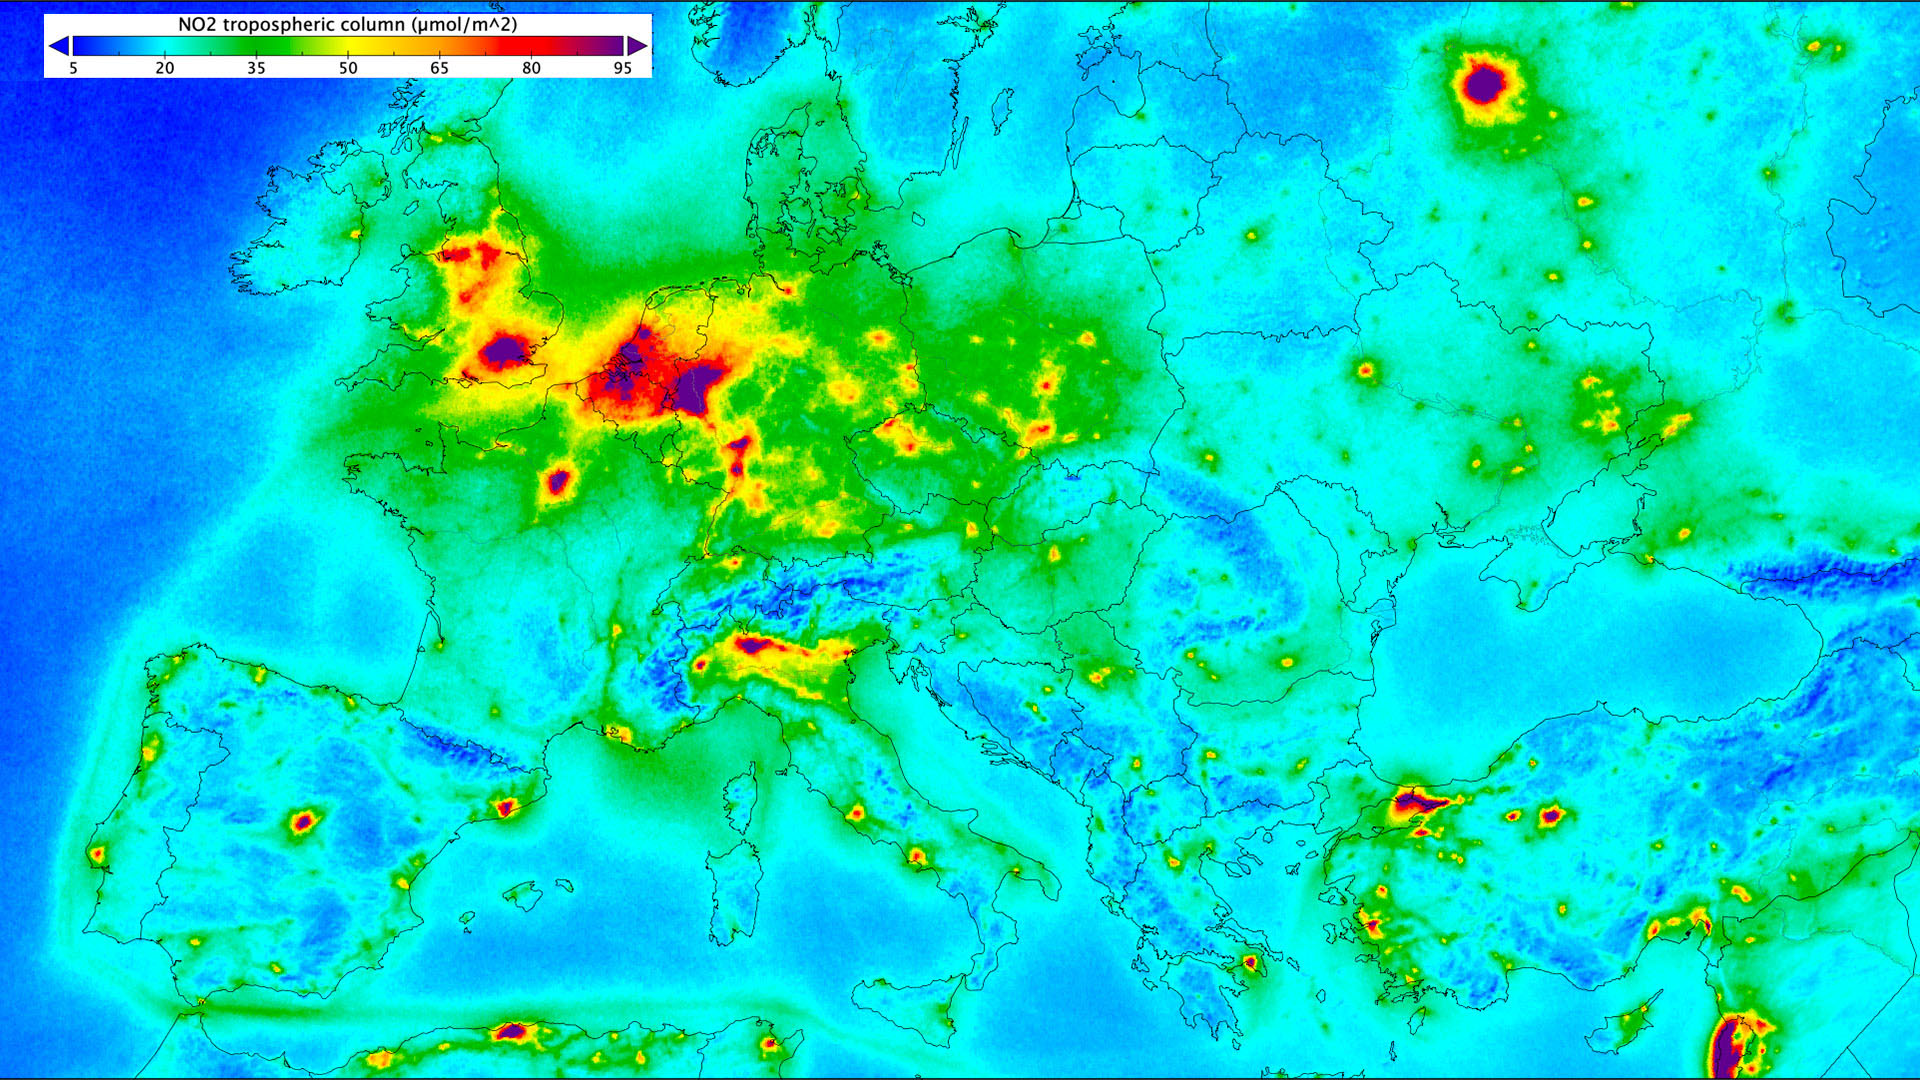
These are the emission inventories that serve as the basis for the diagnoses on which public land-use planning strategies are based. One of the major challenges in improving air quality and combating climate change therefore lies in improving these official inventories, which are fraught with uncertainty and published only every two or three years*. Drawing on its R&D, WaltR is testing two methodologies based on satellite data:
- ADELE, 100% data: using Sentinel-5P satellite data and wind measurements, this method represents the dynamics of pollutant emissions and transport. It's a fast method that identifies the emission "hot spots" in an area so that action can be taken on sensitive areas and, crucially, the funds mobilized for this purpose can be invested wisely. "While awaiting data from the future MicroCarb and CO2M satellites, we are measuring the Nox emitted by the combustion of fossil fuels. Our results show a good correlation with the data supplied by AtmoSud, confirming that we are correctly reproducing the trends on the data we already know," says Éric Pequignot, CEO of WaltR.
-
HERMOSA, merging what the satellite 'sees' with the CHIMERE chemistry-transport model. Comparison of the results with validation data from fixed stations confirms an improvement in concentrations of between 14% and 50%, depending on the location.
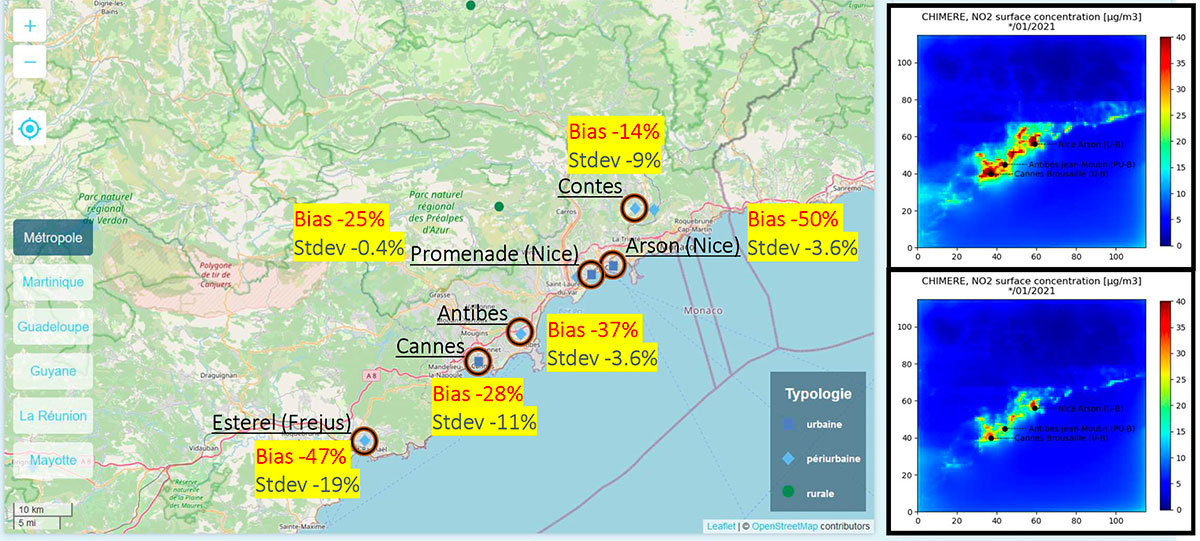
Application of the Hermosa method to a section of the Côte d'Azur, with the percentage improvement in concentration estimates in red. © Lorenzo Costantino (WaltR)
*The need to improve emission inventories is also addressed in the latest progress update from AEROLAB Space, another SCO project devoted to GHGs
Next steps
The EDISON team will soon be adding CO2 and PM2.5 emissions to its mapping. With a view to implementing a universal solution, it will also be mapping NOx and CO2 emissions in Abidjan (Ivory Coast).
It plans to start developing its online platform from September 2024, once it has selected the data to be included (based on the needs identified during the interviews) and determined the expected specifications.