Sat4BDNB provides keys to tackling urban overheating
When it comes to urban fabric and climate, space data is proving to be particularly appropriate and even increasingly effective, which is why the CSTB (French Scientific and technical center for building, Centre Scientifique et Technique du Bâtiment) has asked CNES and CESBIO for support in implementing the Sat4BDNB project.
All the products and indicators developed are available in open data for mainland France on data.gouv.fr and, from spring 2025, on the BDNB website.
The challenge: diagnose to take action
|
The urban heat island or UHI is a physical phenomenon linked to urbanization that affects health, energy, comfort and productivity. Faced with this growing enemy, the CSTB has put in place reliable indicators to assess the intensity of the UHI and identify the most vulnerable sectors where priority action needs to be taken. To do this, and thanks to developments carried out within the SCO framework, it is adding a layer of satellite information to the BDNB (see box opposite) to describe the urban environment. |
The French National Buildings Database (BDNB) Compiling several databases, the BDNB is an open-licence inventory of the attributes of more than 32 million buildings in mainland France: morphology, administrative data, materials, equipment, consumption and energy performance. It forms the essential information base for optimising energy renovation policies for French buildings. |
The answer: 2 products and 5 indicators derived from satellite data
To obtain the targeted indicators, the project has developed two very specific products based on satellite imagery:
- Albedo, now produced operationally on a national scale and available on Theia (read the dedicated news item)
- Vegetation: 5 cities have been produced using Very High-Resolution images, capable of distinguishing the smallest vegetated areas, such as gardens, as well as the height of the vegetation, information that is particularly useful for modelling the urban climate and simulating developments.
|
Towards the democratization of urban spatial data Both albedo and vegetation are the result of work carried out by the CNES over a number of years to assess their relevance to the urban fabric. Sat4BDNB has enabled the production of albedo to be scaled up to the national level. In terms of vegetation, the aim is to enable the ecosystem to grasp this VHR data, which will arrive in large volumes at much lower prices than today, notably with the CO3D mission. VHR imagery completely changes our vision of the urban environment, enabling us to classify it very finely: on the left, the Capitole Place in Toulouse as seen by Sentinel-2 (10 m resolution) and in the center by Pléiades (50 cm resolution). As the last image on the right shows, it's “easy” to highlight the vegetated areas. © Copernicus Sentinel Imagery (left) and CNES/Distribution Airbus DS (center and right) |
Then, by cross-referencing these two products with demographic and meteorological databases, 5 indicators were created:
- The UHI indicator, which takes into account all the phenomena that cause UHI.
👉 Advantages: production of a homogenous map applied to the whole of France, very rapid calculation, enabling each territory to test different UHI mitigation actions, possible connections with existing planning tools, but also with more sophisticated models to simulate the urban climate.
- The Adaptation Strategy and Associated Costs indicators, which assess two types of action: nature-based solutions, in particular revegetation, and changes in albedo depending on the roofing materials used (mainly concrete or terracotta in France).
👉 According to the tests carried out by the project, vegetation has a maximum potential mitigation capacity of 2.5°C and albedo 2.2°C. However, the investment cost of nature-based solutions is almost double that of albedo-based solutions.
- The Mitigation Effectiveness indicator, which combines the two previous indicators to prioritize the actions to be taken.
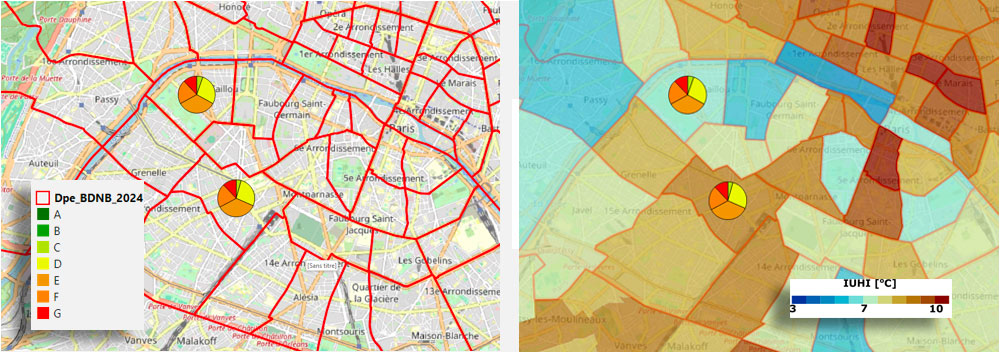
👉 Example 1: of two neighborhoods in the same town with similar EPD indicators, one has a UHI of 8°C and the other of 6.4°C: it is very clear which neighborhood should be given priority.

▲ EPD indicators on the left and UHI indicators on the right. © CSTB
👉 Example 2: of two districts in the same city with similar UHI mitigation scores, one requires an investment cost of €38m and concerns 18,000 inhab/km2 and the other €7m targeting 33,000 inhab/km2: the choice of which district to prioritize is again very clear.
- Vulnerability (of the population) to heat indicator, which takes into account socio-economic and demographic data, the energy consumption of buildings, green spaces and the intensity of the UHI.
👉 In the Île-de-France region, the indicator shows that the areas at risk are not just concentrated in the inner suburbs of Paris.
The rest: IMPROVE
As a direct extension of Sat4BDNB, the CSTB has submitted the IMPROVE project to Ademe, which has accepted it. At the heart of the Plus fraîche ma ville (cooler my city) consortium, the aim is to involve local authorities more strongly in actions to mitigate UHIs, thanks to an open source tool enabling them to test and evaluate possible strategies.


