

SCOFrance
Partners
- France : UMR Espace-Dev, IRD, CNES
- Inidan Ocean: University of la Réunion, IOGA, IST, BNGRC
Useful linksProject presentation
Key wordsCyclones, impact, trajectory, flooding, rainfall, forecasts
Cimopolée: the demonstrator is online
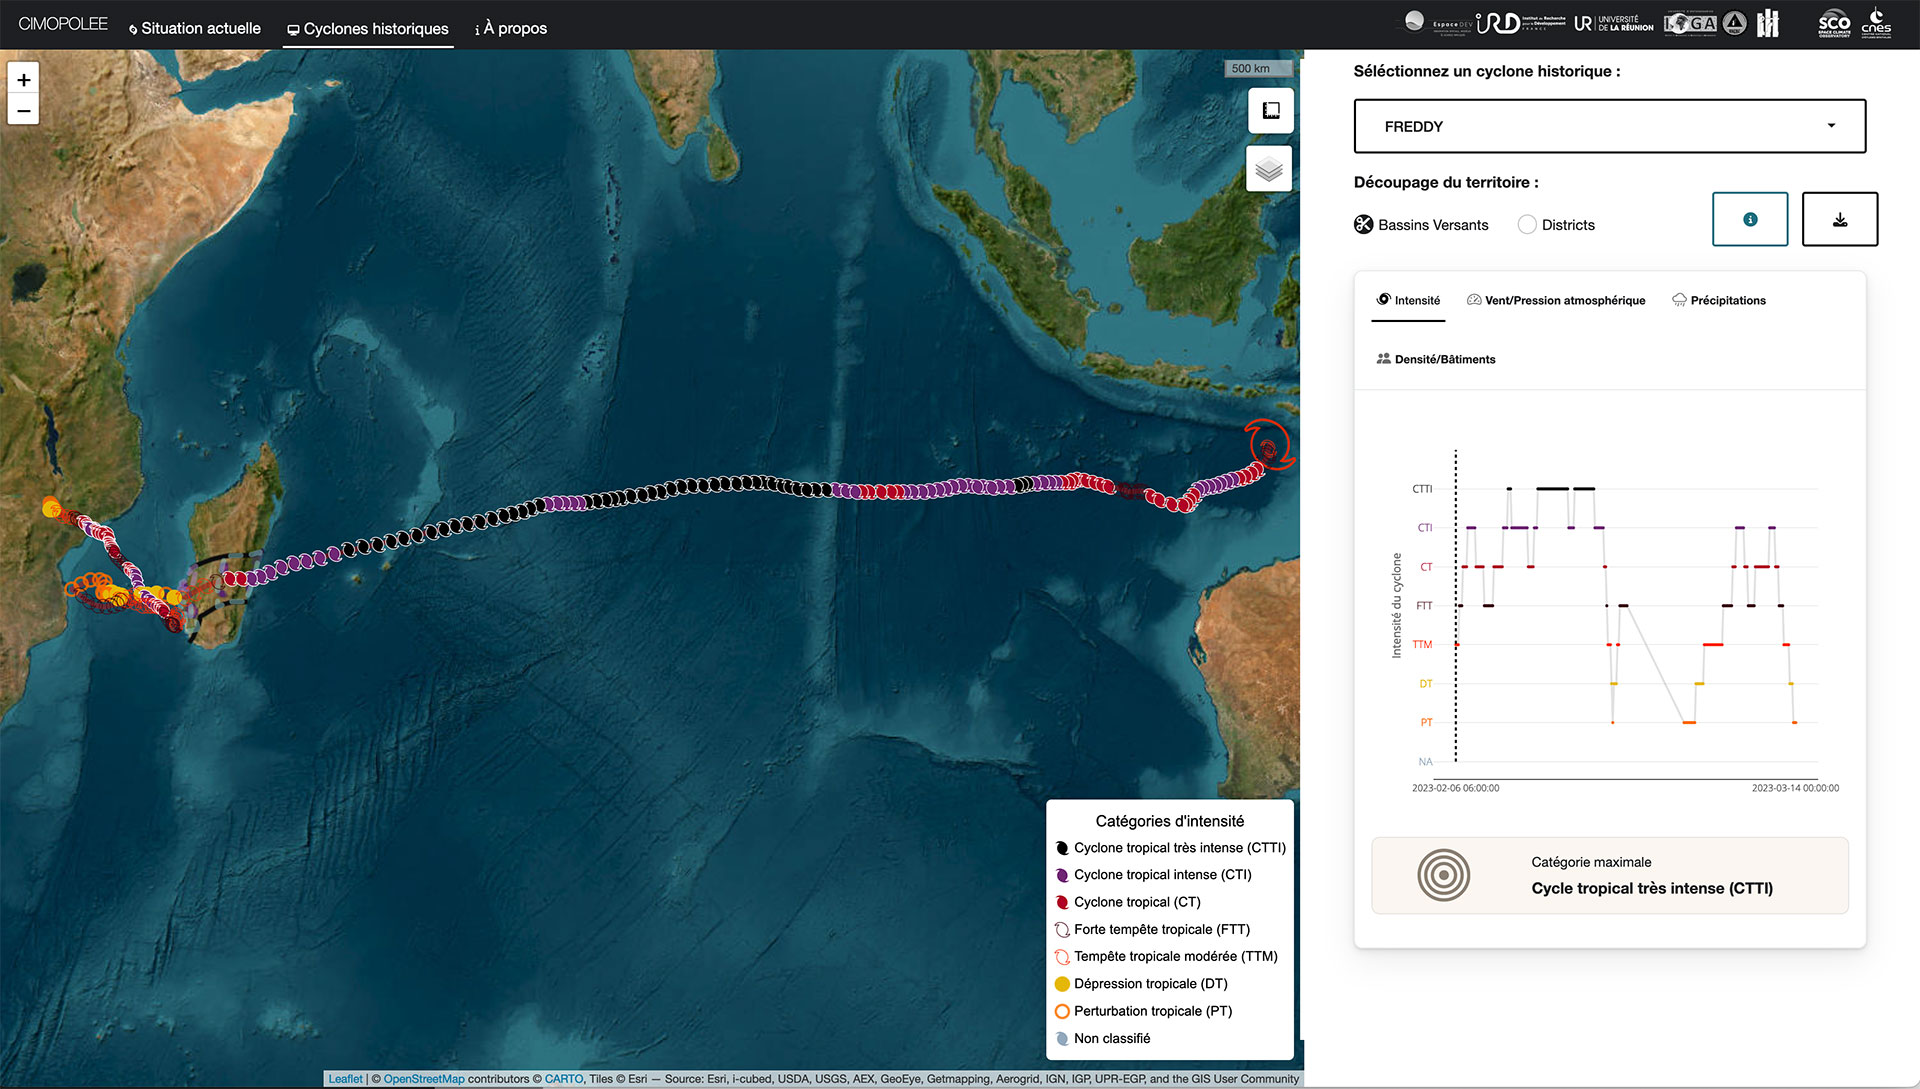
With rising temperatures, particularly in the oceans, very intense cyclones are becoming increasingly frequent. In this context, understanding how they work and correlating them with their impacts is becoming essential. This is the raison d'être of the Cimopolée project, which is launching its online demonstrator.
The free-access tool offers three main functions corresponding to its main objectives:
-
The "Current situation" (“Situation actuelle”) tab allows you to see in real time whether a cyclone is present in the IO zone and to track its trajectory;
-
The "Historical cyclones" (“Cyclones historiques”)tab provides more comprehensive information on the major cyclones of the last ten years (detection of flooded areas, rainfall balance, etc.);
-
The "About" (“À propos”) tab provides background information on the data used and how to download it, enabling users to carry out more in-depth analyses using their GIS or statistical software.
💡In the "Historical cyclones" tab, clicking on the "i" button launches a short tutorial for new users. To explore the tool's features in more detail, download the tutorial in pdf format (in French).
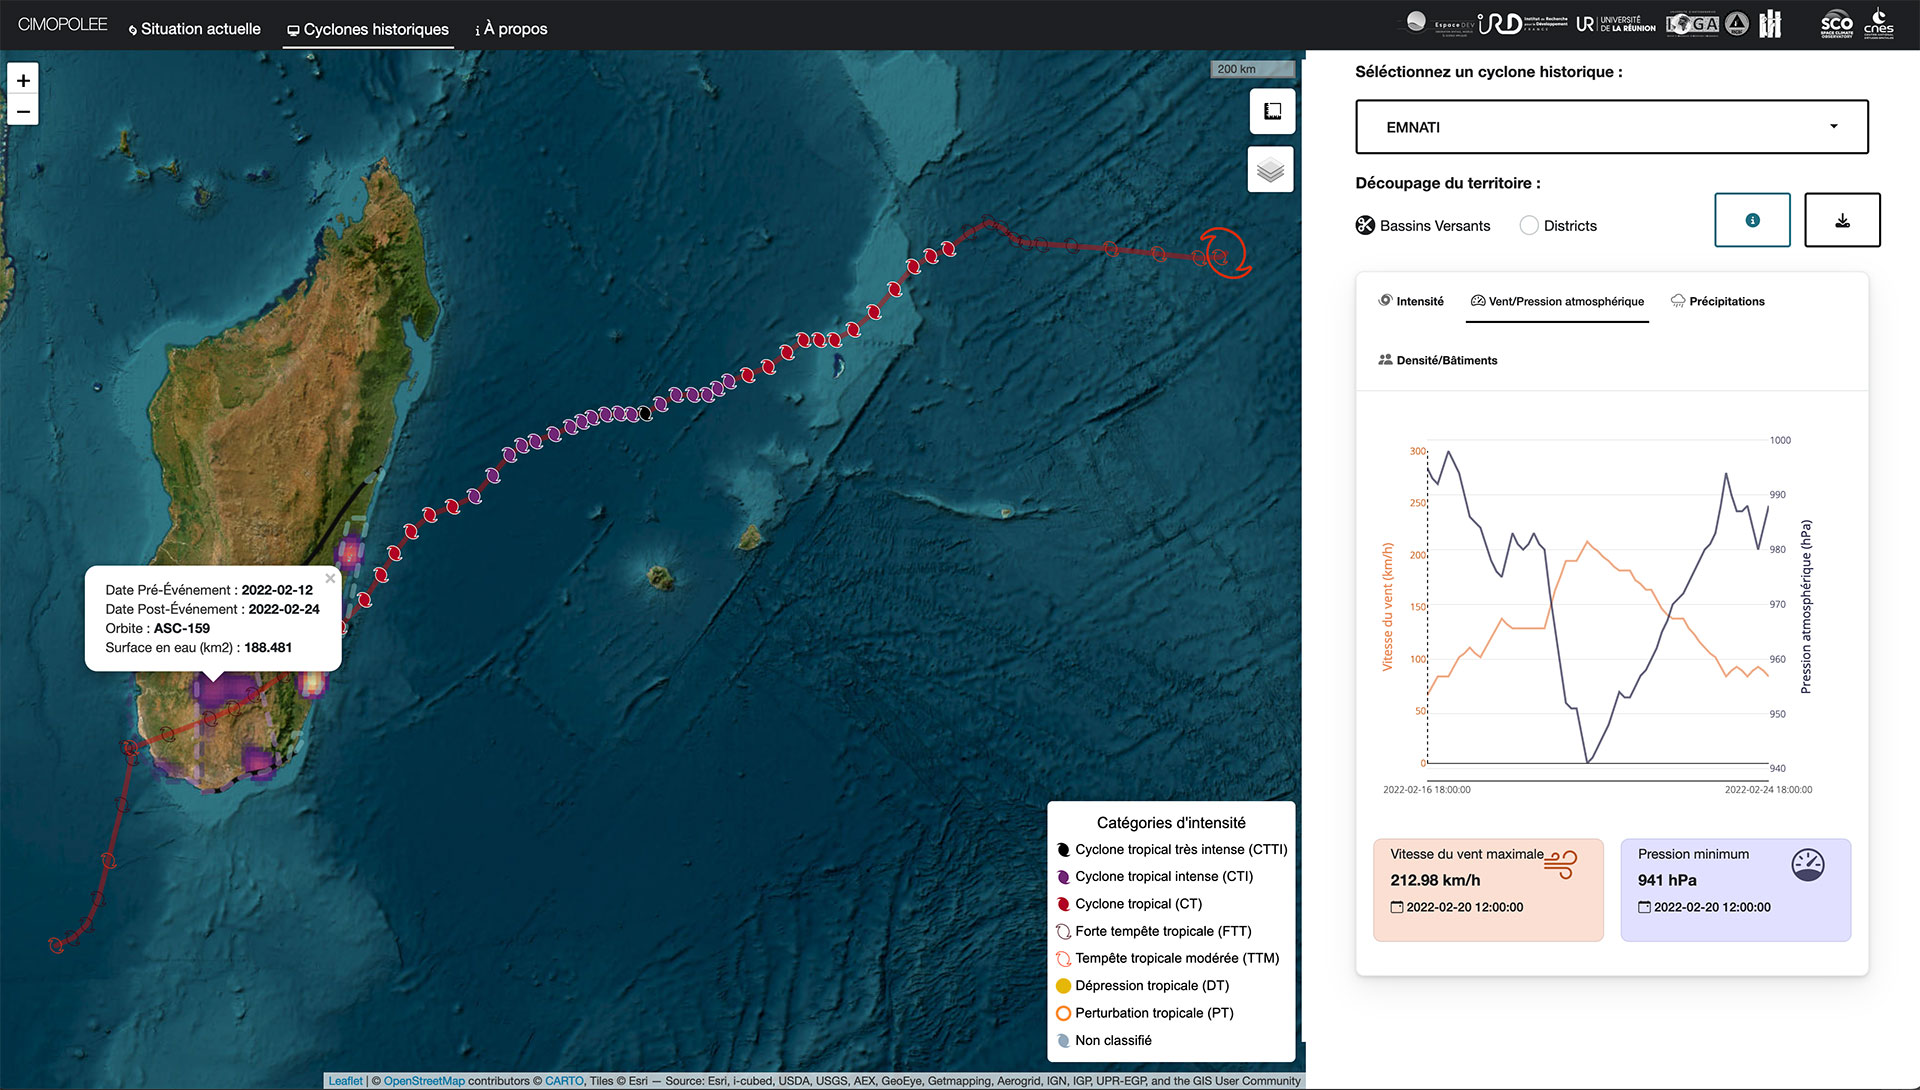
Another example of how information is displayed, this time for cyclone Emnati in February 2022. The panel on the right shows not the intensity curve as in the Freddy example, but the wind and atmospheric pressure curves. A label on the map shows the areas flooded. © Cimopolée
👉More details about the tool's potential and initial reactions from Madagascar's National Risk and Disaster Management Office (BNGRC) in our news item Facing cyclones with Cimopolée (23/11/2023).